
WHITE PAPER
World’s First Computer-Vision-Based Cargo Settlement for Dry Bulk Ports
How a Gulf Coast deployment proved that cameras can replace century-old measurement methods, and why the $3–6 billion cargo discrepancy problem finally has a technology solution
$50K–$100K
Per-vessel cargo disputes eliminated through continuous, auditable evidence
$3–6B
Annual global exposure to cargo discrepancies
0
Ports worldwide using CV for cargo settlement — until now
5.6B
Tonnes of dry bulk traded globally in 2024
THE PROBLEM
A $3–6 Billion Problem Hiding in Plain Sight
Every dry bulk cargo discharge in the world, every ship unloading grain at the Mississippi River corridor, every iron ore vessel at Port Hedland, every aggregate carrier at a Gulf Coast berth, begins and ends the same way it has since the mid-20th century: a surveyor reads six painted markings on the ship’s hull, samples the water density with a hydrometer, sounds every ballast tank, and applies a chain of manual corrections using the vessel’s hydrostatic tables.
This is a draft survey. It takes approximately two hours. It costs $500–$3,500 per survey. And it is the foundation upon which the entire dry bulk shipping industry, $155–168 billion in annual trade value, settles its cargo accounts.
The problem is not that draft surveys are inaccurate. A competent surveyor on a well-maintained vessel achieves ±0.5% accuracy. The problem is that ±0.5% on a 50,000-tonne Panamax cargo of grain valued at $300/tonne equals $75,000 of ambiguity per discharge. Multiply that across 160,000+ annual discharge events globally, and the aggregate cargo value at risk from measurement uncertainty reaches $2.9–5.8 billion per year.
Unlike the tanker industry, which agreed decades ago on a standard 0.5% outturn allowance, no industry-agreed shortage allowance exists for dry bulk cargo. Every discrepancy is potentially a dispute. Every dispute involves surveyors, P&I clubs, and often lawyers. The Japan P&I Club documented 2,183 cargo shortage incidents over seven years. The American Club found average incident costs ranging from $117,000 (Turkey) to $187,000 (India). Total annual P&I cargo shortage payouts across the 12 International Group clubs are estimated at $400–640 million.
“Before this system, every vessel discharge ended the same way \u2014 the ship\u2019s figure said one thing, our figure said another, and we\u2019d spend hours negotiating the difference. That was just how the industry worked.”
— [PLACEHOLDER: General Manager, terminal operator at Port Tampa Bay]
The Sources of Error Are Well-Documented and Unfixable
| Error Source | Impact | Correctable? |
|---|---|---|
| Ballast water measurement | Slack tanks, residual water, density variations | Partially — surveyor-dependent |
| Hull deformation (hogging/sagging) | No established correction method exists | No |
| Vessel "constant" drift | ~0.5% per year as ships age | Only via dry-dock lightship survey |
| Draft mark reading in swell | ±5–10 cm variation per reading | Partially — with digital tools |
| Water density sampling location | Surface vs. keel density can differ | Partially |
| Tank sounding inaccuracies | Residual water in "empty" tanks | No — structural limitation |
MEASUREMENT LANDSCAPE
Every Existing Measurement Technology Has the Same Limitation
The natural question is: why not use shore-based measurement instead of relying on ship-side draft surveys? The answer is that shore-based systems exist, belt scales, truck weighbridges, hopper scales, grab weighing systems, but each carries its own limitations, and none provides the real-time, continuous, multi-point reconciliation that eliminates settlement disputes at their source.
| Technology | Accuracy | Capital Cost | Limitation for Settlement |
|---|---|---|---|
| Draft Survey | ±0.5–2% | $500–$3,500/survey | Periodic (before/after only), surveyor-dependent |
| Belt Scales | ±0.125–1% | $30K–$100K+ | Drift between calibrations; single measurement point |
| Hopper Scales | ±0.1–0.2% | $50K–$250K+ | Grain terminals only; massive structural requirements |
| Truck Weighbridges | ±0.1–0.2% | $40K–$150K | Throughput-limited to 25–60 trucks/hour |
| Grab Weighing | ±0.5–3% | $15K–$80K | Shock loading, calibration drift, variable tare weight |
| LiDAR Stockpile | ±1–3% vol. | $100K–$500K+ | Inventory only; requires density assumptions |
| Nuclear Gauges | ±0.5–1% | $20K–$80K | NRC regulatory burden; declining adoption |
Every technology in this table measures cargo at a single point in the material flow chain. None tracks the complete journey from ship hold through crane through hopper through truck/conveyor to warehouse. The industry doesn’t need a more accurate scale. It needs a system.
COMPETITIVE ANALYSIS
The Competitive Landscape: A Decisive Technology Gap
After researching every major cargo measurement vendor, every port technology startup, every CMMS platform with maritime modules, and the academic literature, one finding is unambiguous: no commercial product on the market today uses computer vision to produce a cargo settlement document for dry bulk discharge.
Maritime AI Startups
| Company | What They Do | Cargo Settlement? |
|---|---|---|
| PortXchange (Netherlands) | Port call optimization, ETA prediction | |
| Windward (Israel) | AIS vessel tracking, sanctions compliance | |
| Voxel AI ($61M+ raised) | CV-based workplace safety — PPE, vehicle hazards | |
| Sinay (France) | Port environmental monitoring | |
| Bearing AI | Fleet management, voyage optimization | |
| viAct (Hong Kong) | Construction/port safety monitoring via CCTV |
Crane OEMs
| OEM | Technology | Settlement-Grade? |
|---|---|---|
| Liebherr SmartGrip | Self-learning AI optimizes grab fill rates via load sensors | |
| Liebherr LiDAT | GPS telematics, cycle recognition, fleet KPIs | |
| Konecranes TRUCONNECT | IoT sensor data — motor starts, wire rope, work cycles | |
| ABB Port Crane Automation | Remote operation, QuayPro work-queue visualization | |
| Kalmar SmartPort / Navis N4 | Terminal operating system, dispatch, yard management |
No product. No startup. No academic deployment. The space is empty.
THE SOLUTION
The Sensfix Solution: See Everything, Calibrate Everything, Settle Everything
What is now deployed at Port Tampa Bay represents a fundamentally different approach to cargo measurement. Instead of adding another sensor at a single point, the system watches the entire cargo flow through existing infrastructure, cameras, and reconciles what it sees against the ship’s own displacement data.
System Architecture
Ship
Draft reports every ~12 hours → ground truth
Crane (Camera 1 & 2)
Swing detection, jaws-open confirmation, VLM crane attribution
Hopper
Buffer state monitoring, spill detection zones
Conveyor (Camera 3)
Cross-sectional area × belt speed = volumetric flow
Truck
5-state cycle tracking, dwell time → load estimation
Warehouse
Final reconciliation, settlement report generation
Sees Continuously
CV monitors every crane swing, every conveyor load, every truck cycle, 24/7. Draft surveys see the ship twice. Belt scales see one point. This system sees everything.
Calibrates Automatically
Draft reports provide ground truth. System self-corrects. No surveyor visits. No recalibration shutdown. No drift between calibrations.
Produces Auditable Documents
Not dashboards. Formal settlement reports with confidence intervals, per-crane breakdown, discrepancy analysis, and timestamped audit trail.

CAPABILITIES
Eleven Capabilities That Define the New Standard
Each capability below represents a sub-function of the bulk cargo unloading operation. For each, we document the current state of the art, the specific pain point, and how the deployed system addresses it. Where relevant, we note whether the capability has a commercial equivalent or constitutes a first-of-kind deployment.
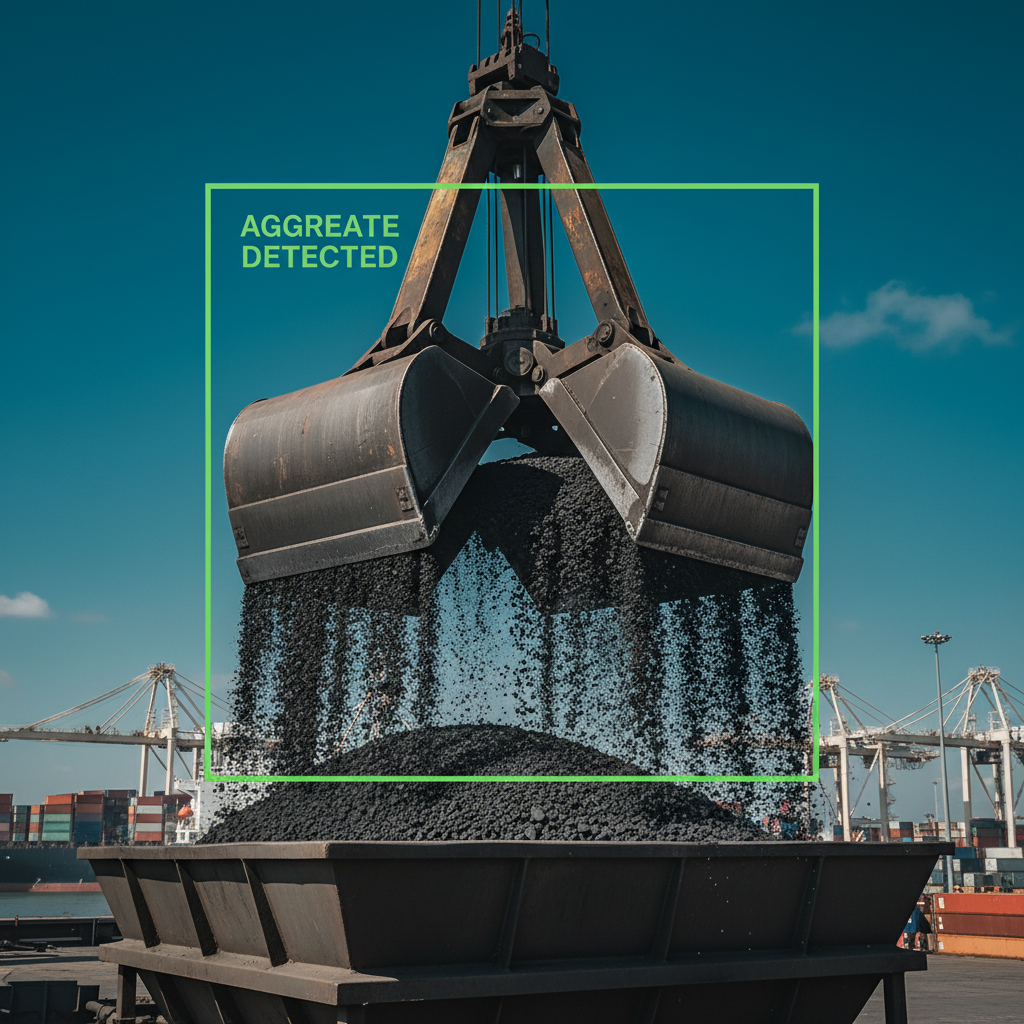
Real-Time Crane Swing Cycle Counting
CURRENT STATE
Manual tallying by a dock clerk with a handheld counter, or post-hoc review of crane PLC data. Some operational tracking tools exist that count grab cycles, but none produce commercially binding settlement documents.
THE PROBLEM
Manual counts miss swings during shift changes, breaks, and distractions. PLC data records motor events but not actual cargo discharge confirmation (the bucket may cycle without fully discharging). Neither provides per-swing volume estimation.
WHAT THE SYSTEM DOES
Computer vision detects each crane bucket entering the discharge zone with jaws open — confirming actual material release, not just bucket movement. Each swing is counted, timestamped, and attributed to the correct crane using VLM-based cable tracing (a proprietary method where a vision-language model traces the physical cables from the detected bucket upward to identify which crane tower it belongs to).
VLM-based equipment affiliation via physical connection tracing has no equivalent in any published product, academic paper, or commercial deployment.
KEY METRIC
Every swing counted. Every swing attributed. Every swing timestamped. Zero manual intervention.
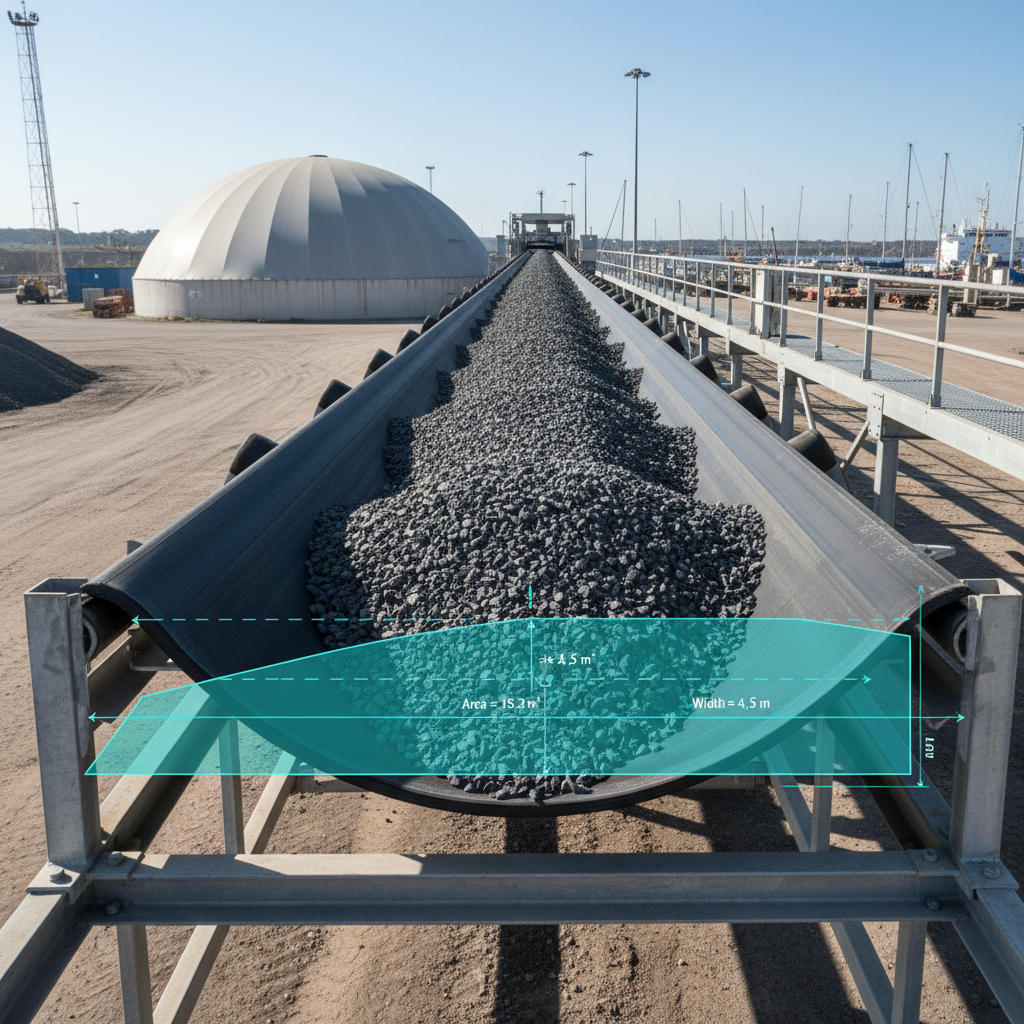
Conveyor Volumetric Flow Measurement
CURRENT STATE
Trade-certified belt scales (Thermo Fisher Ramsey, Schenck MULTIBELT) costing $30,000–$100,000+ per installation, requiring recalibration every 3–6 months. Accuracy: ±0.125–1% when properly maintained.
THE PROBLEM
Belt scales are accurate when freshly calibrated but drift between calibrations due to material buildup, belt tension changes, and environmental factors. Recalibration requires shutting down the conveyor. Many terminals lack trade-certified belt scales entirely.
WHAT THE SYSTEM DOES
A camera mounted above the conveyor measures the cross-sectional area of material on the belt. Area multiplied by belt speed yields volumetric flow rate. Continuous integration over time provides total volume. Calibration against draft-derived tonnage corrects for density variations.
Camera-only conveyor volume measurement integrated with draft calibration for settlement — no commercial equivalent exists.
KEY METRIC
Continuous measurement. No hardware on the belt. No calibration downtime. No drift between calibrations.
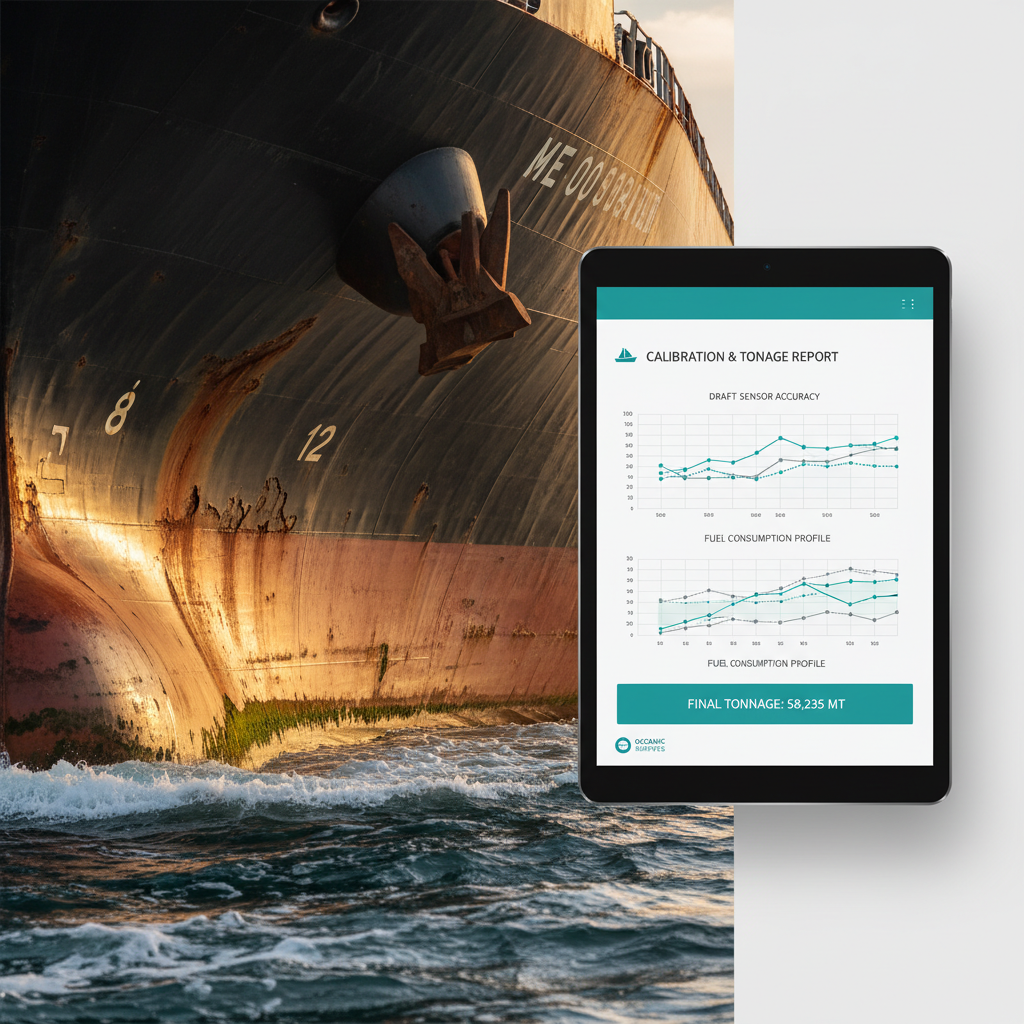
Draft-Calibrated Settlement Report Generation
CURRENT STATE
Settlement based on comparing two draft surveys (initial and final) with discrepancies negotiated between ship owner, terminal operator, and cargo receiver. No standardized shortage allowance for dry bulk.
THE PROBLEM
A draft survey sees the ship twice — before and after discharge. Everything in between is a black box. If the final figure differs from the bill of lading by 1%, there is no data to explain why. The result is a negotiation, not a resolution.
WHAT THE SYSTEM DOES
Generates a formal settlement report combining CV-measured cargo volume (calibrated against draft-derived tonnage) with per-crane breakdown, conveyor throughput, spill deductions, confidence intervals, and a complete audit trail suitable for commercial documentation.
The specific application of CV-based crane counting calibrated against ship draft data for cargo settlement — no commercial equivalent exists.
KEY METRIC
Every tonne accounted for or flagged. Settlement based on auditable evidence, not negotiation. $50K–$100K per-vessel disputes eliminated.
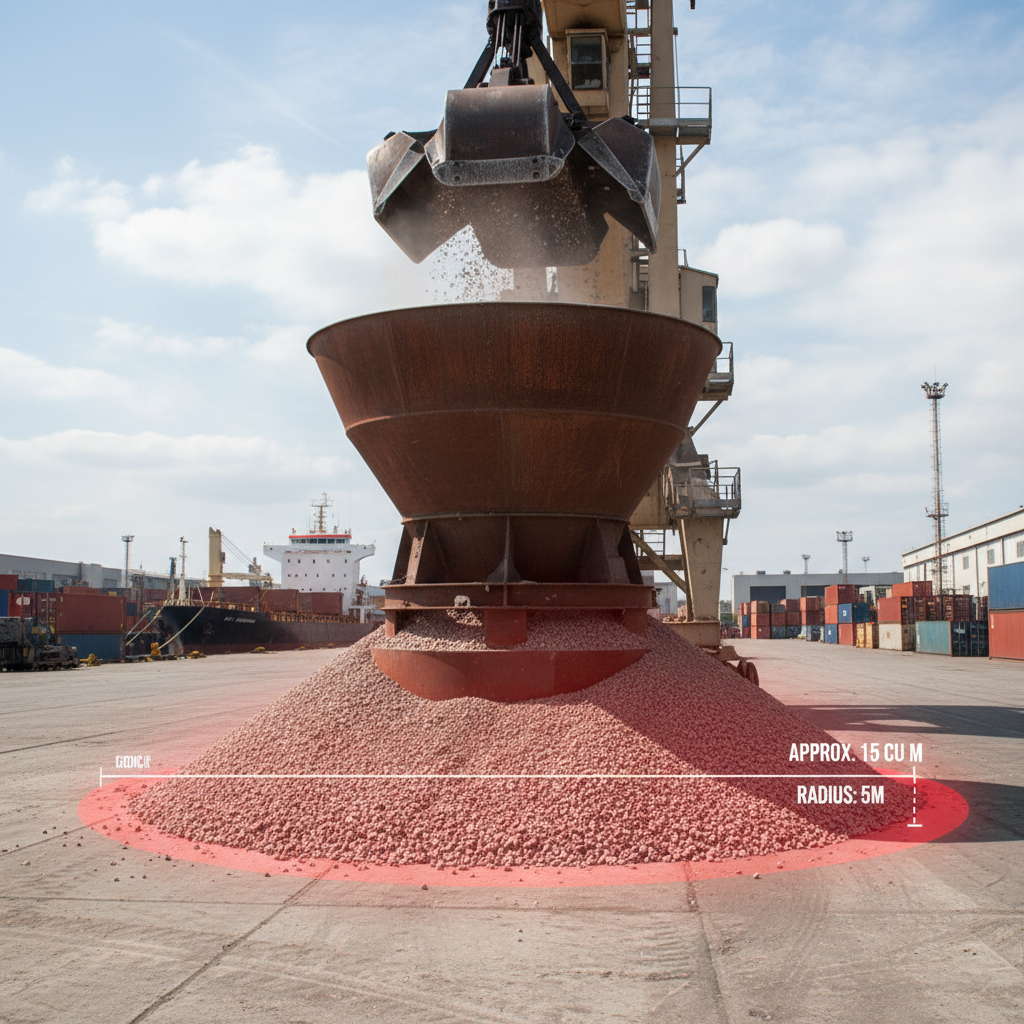
Cargo Spill and Loss Monitoring
CURRENT STATE
Spillage during discharge is estimated at 0.1–0.5% and accepted as an uncounted loss. No real-time measurement technology exists for monitoring spillage at hopper zones, conveyor transfer points, or water boundaries.
THE PROBLEM
When the ship figure says 50,000 tonnes and the shore figure says 49,000 tonnes, the 1,000-tonne discrepancy is attributed to "losses during discharge" — but no one can prove where the loss occurred. This creates an accountability vacuum.
WHAT THE SYSTEM DOES
Defines spill detection zones around the hopper, conveyor transfer points, and water boundary. CV detects material falling outside designated areas, estimates spill volume from video analysis, and includes spill deductions in the settlement report with video evidence and accountability assignment.
Spillage monitoring for financial settlement deduction (not environmental compliance) — no commercial equivalent exists.
KEY METRIC
Every spill documented. Every loss quantified. Accountability assigned with video evidence.
Per-Crane Performance Breakdown
CURRENT STATE
Most terminals track aggregate throughput (tonnes per shift) but not per-crane productivity. Liebherr LiDAT and Konecranes TRUCONNECT provide per-crane IoT telematics from onboard sensors, not external vision.
THE PROBLEM
When two cranes discharge a vessel simultaneously, a single belt scale cannot distinguish how much cargo came from each crane. Draft surveys measure total vessel displacement change, not which crane contributed what.
WHAT THE SYSTEM DOES
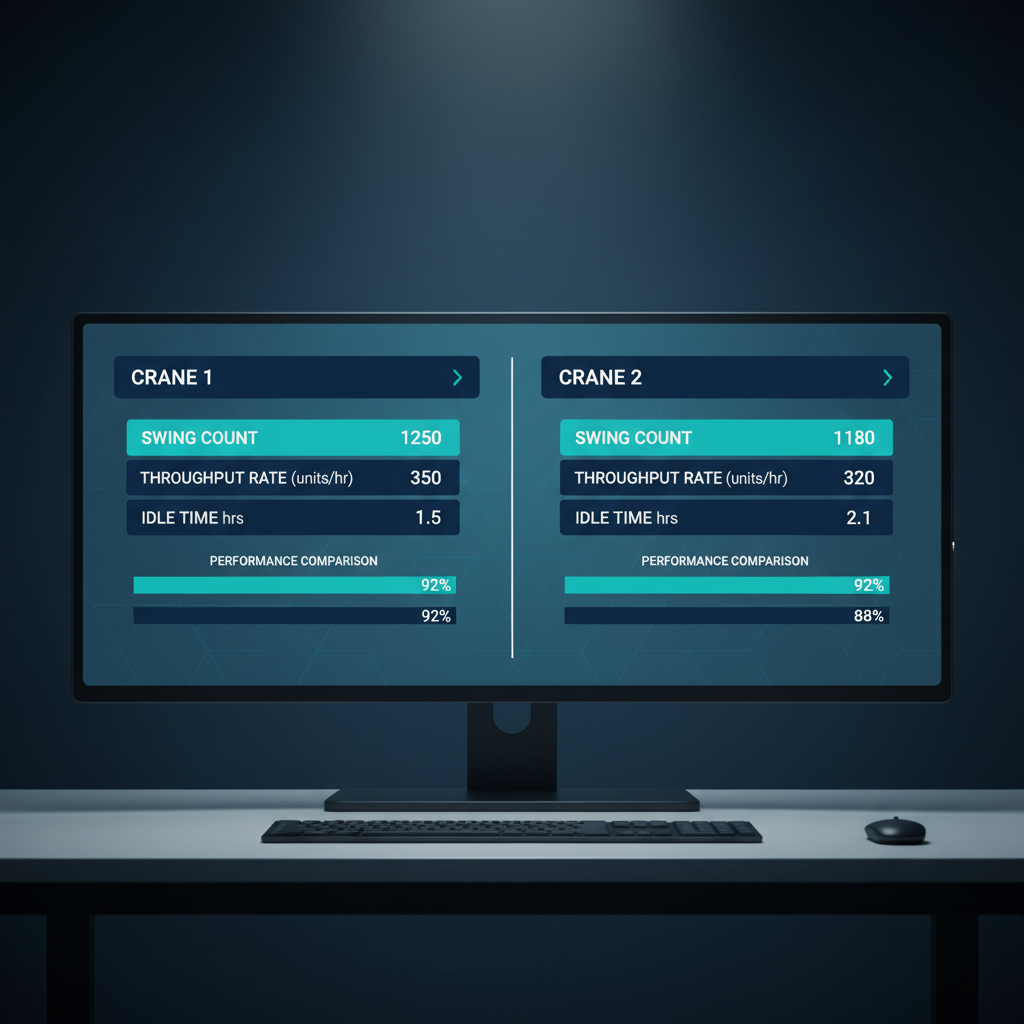
Because the system attributes each swing to a specific crane (via VLM cable tracing), it generates per-crane metrics: swing count, estimated volume per swing, idle time, cycle time, throughput rate. Enables identifying underperforming cranes and comparing operator efficiency.
Per-crane IoT telematics exist (Liebherr LiDAT, Konecranes TRUCONNECT) but from onboard sensors. Vision-based per-crane attribution is novel.
KEY METRIC
Per-crane visibility. Per-operator comparison. Per-shift trend analysis. All from cameras.
Real-Time Operator Pacing Dashboard
CURRENT STATE
Crane operators receive a shift target and work toward it with no real-time feedback on pace. Managers see aggregate numbers at end of shift. No system provides dynamic pacing targets.
THE PROBLEM
Without real-time pacing feedback, operators don’t know if they’re ahead or behind until it’s too late. Night shifts, when supervision is minimal and fatigue sets in, are particularly vulnerable.
WHAT THE SYSTEM DOES
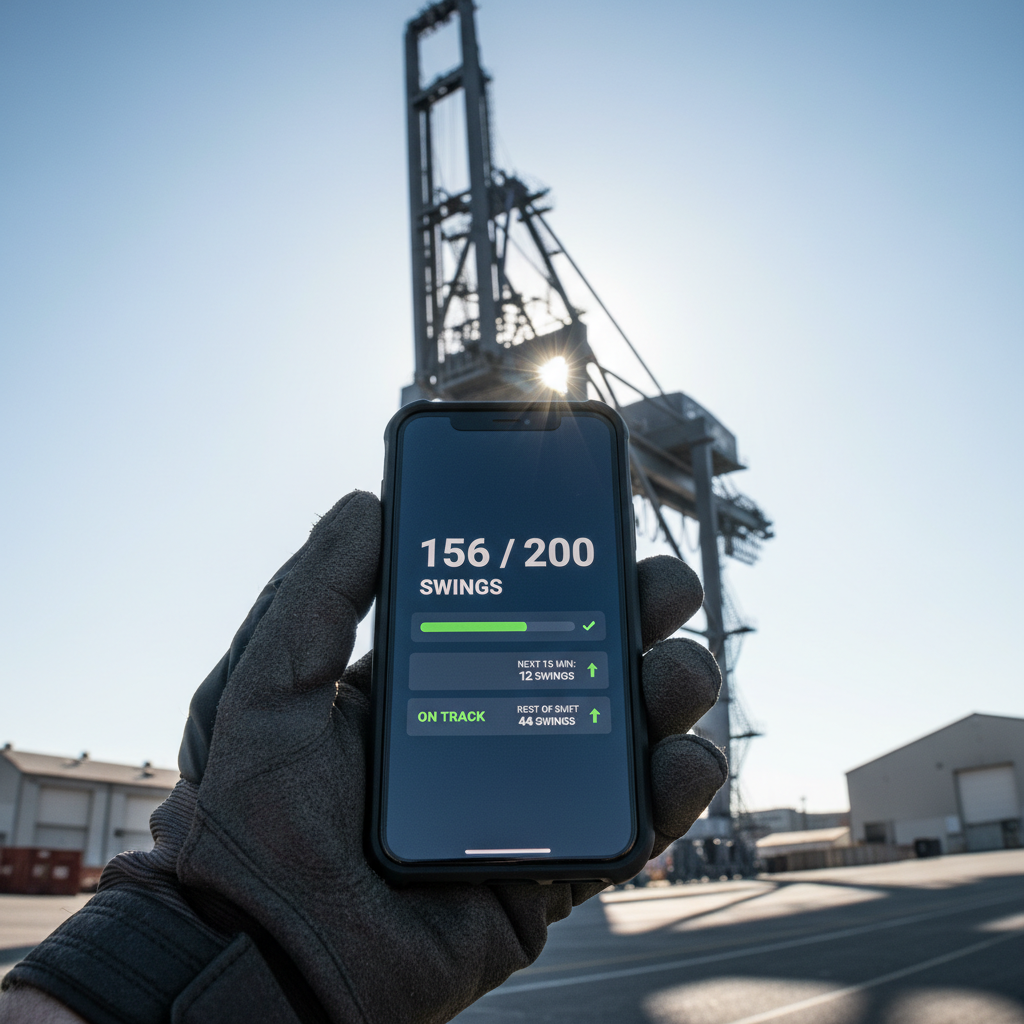
A mobile interface shows each operator their real-time swing count, required pace (remaining work ÷ remaining time), pace delta, and status (AHEAD / ON_TRACK / SLIGHTLY_BEHIND / BEHIND). Ship manifest data feeds the pacing engine and updates every 12 hours.
No existing system provides CV-derived real-time pacing feedback to crane operators. No equivalent exists in the port/bulk crane domain.
KEY METRIC
Operators know exactly where they stand, every minute of every shift. Managers see all operators at a glance.
Behavioral State Inference from Equipment Trajectory
CURRENT STATE
Industrial fatigue detection relies on monitoring the operator directly — face-tracking cameras, EEG headbands, or IR eyelid sensors. None analyze equipment movement patterns.
THE PROBLEM
Direct operator monitoring requires additional cameras or wearables in the crane cab — a privacy concern, a hardware cost, and a deployment barrier.
WHAT THE SYSTEM DOES
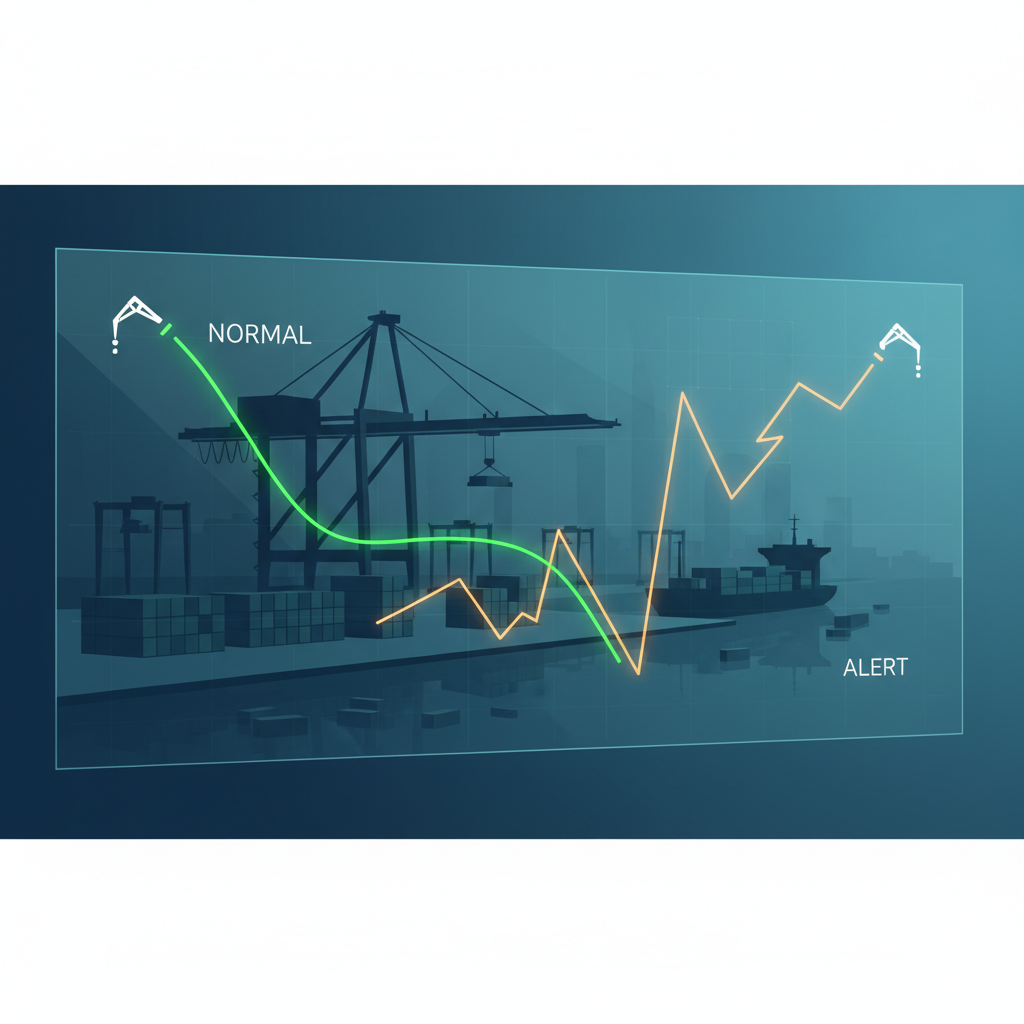
Analyzes crane trajectory patterns — path deviation, time deviation, movement smoothness — across consecutive swing cycles. Classifies operator state as NORMAL, POTENTIAL_DISTRACTION, or POTENTIAL_FATIGUE. Alerts sent to manager dashboard.
Equipment-trajectory-based state inference exists in automotive (Mercedes ATTENTION ASSIST). No system has implemented it for industrial crane operations.
KEY METRIC
Fatigue and distraction detected from the crane’s movements — not a camera in the operator’s face.
Truck Load Cycle Detection
CURRENT STATE
Truck weighbridges count trucks and weigh loads at the gate. No system tracks the complete cycle: arrival → queue → positioning → loading → departure, correlated with upstream crane events.
THE PROBLEM
A gap exists between "cargo leaving the crane" and "cargo arriving at the warehouse." Without monitoring the hopper buffer point, end-to-end flow reconciliation is impossible.
WHAT THE SYSTEM DOES
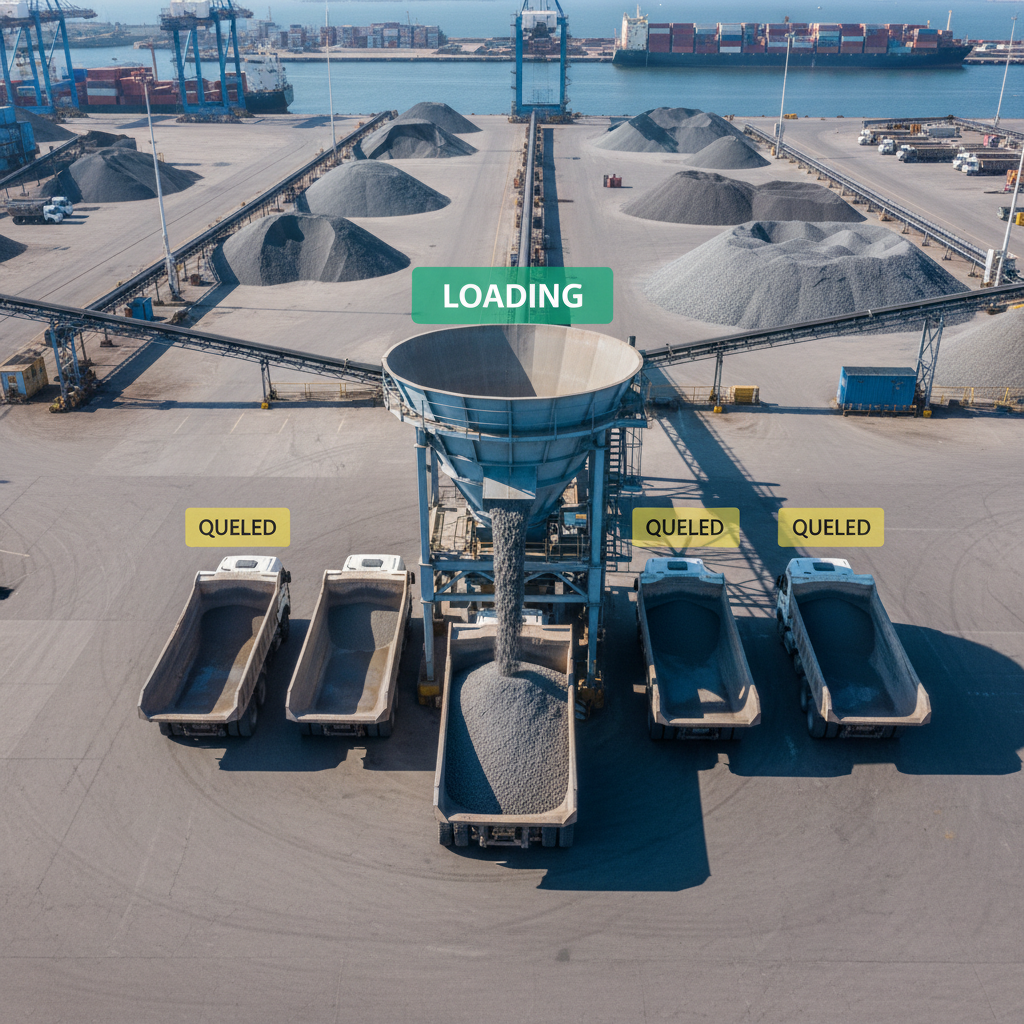
A five-state vehicle tracking system (EMPTY → QUEUED → UNDER_HOPPER → LOADING → DEPARTING) monitors each truck’s complete cycle. Dwell time under the hopper provides estimated load volume. Each truck load is correlated with upstream crane events.
Vehicle cycle detection with upstream equipment correlation for material flow continuity — no commercial equivalent exists.
KEY METRIC
Every truck. Every load. Every correlation to upstream crane events. End-to-end accountability.
Cross-Camera Equipment Verification
CURRENT STATE
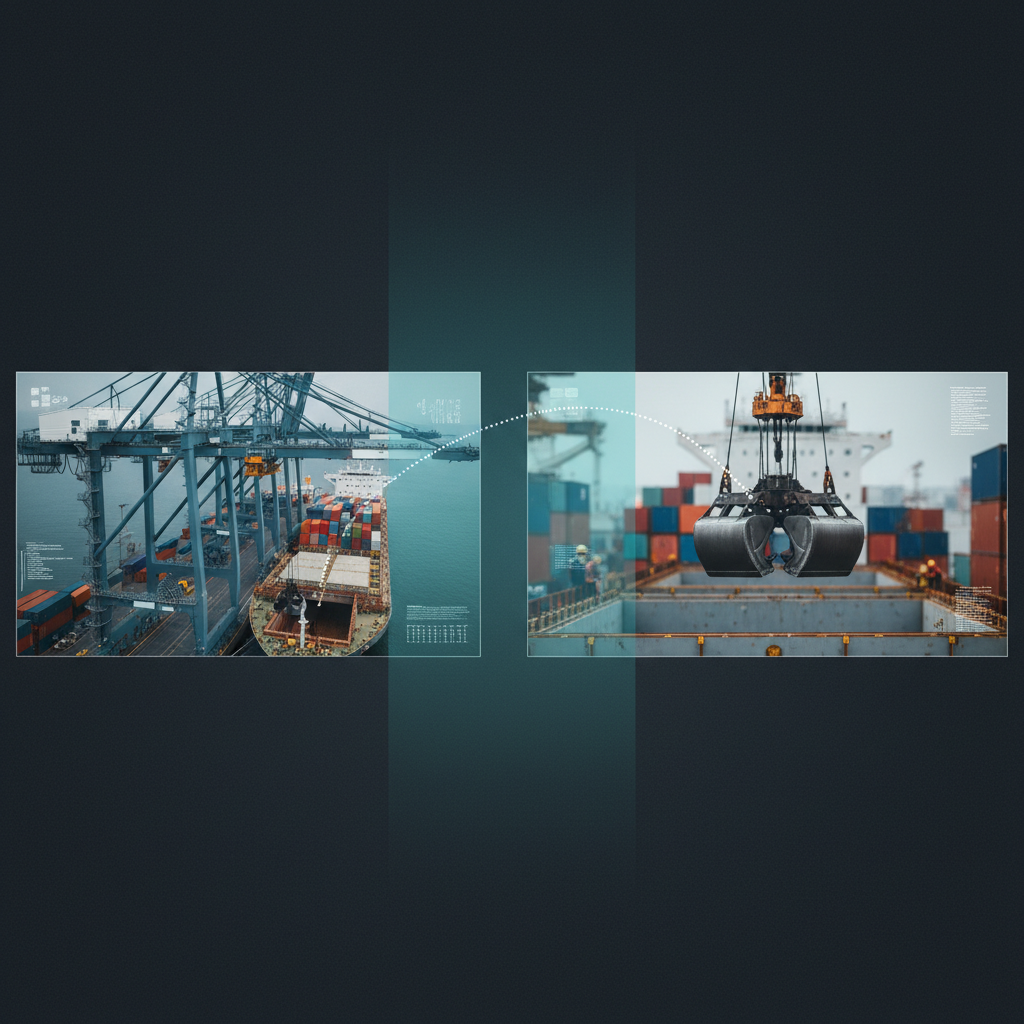
When multiple cameras cover overlapping areas, the same crane bucket may be detected by both cameras — creating double-counting risk. No existing system uses AI to verify identity across cameras.
THE PROBLEM
Multi-camera deployments are necessary because a single camera cannot cover the entire berth. But overlapping fields of view create ambiguity: is the bucket in Camera 1 the same bucket in Camera 2?
WHAT THE SYSTEM DOES
When an object is detected in an overlap zone, the system extracts image regions from both cameras, transforms coordinates to a common reference frame, and queries a vision-language model to determine identity: same equipment (fuse, count once) or different equipment (track separately).
Cross-camera LLM verification for industrial monitoring — no commercial equivalent exists.
KEY METRIC
Zero double-counts. Multi-camera deployments without accuracy compromise.
Hopper Buffer State Monitoring
CURRENT STATE
Terminal operators rely on visual observation or level sensors to monitor hopper fill state. No system uses CV to estimate pile height and provide workflow recommendations.
THE PROBLEM
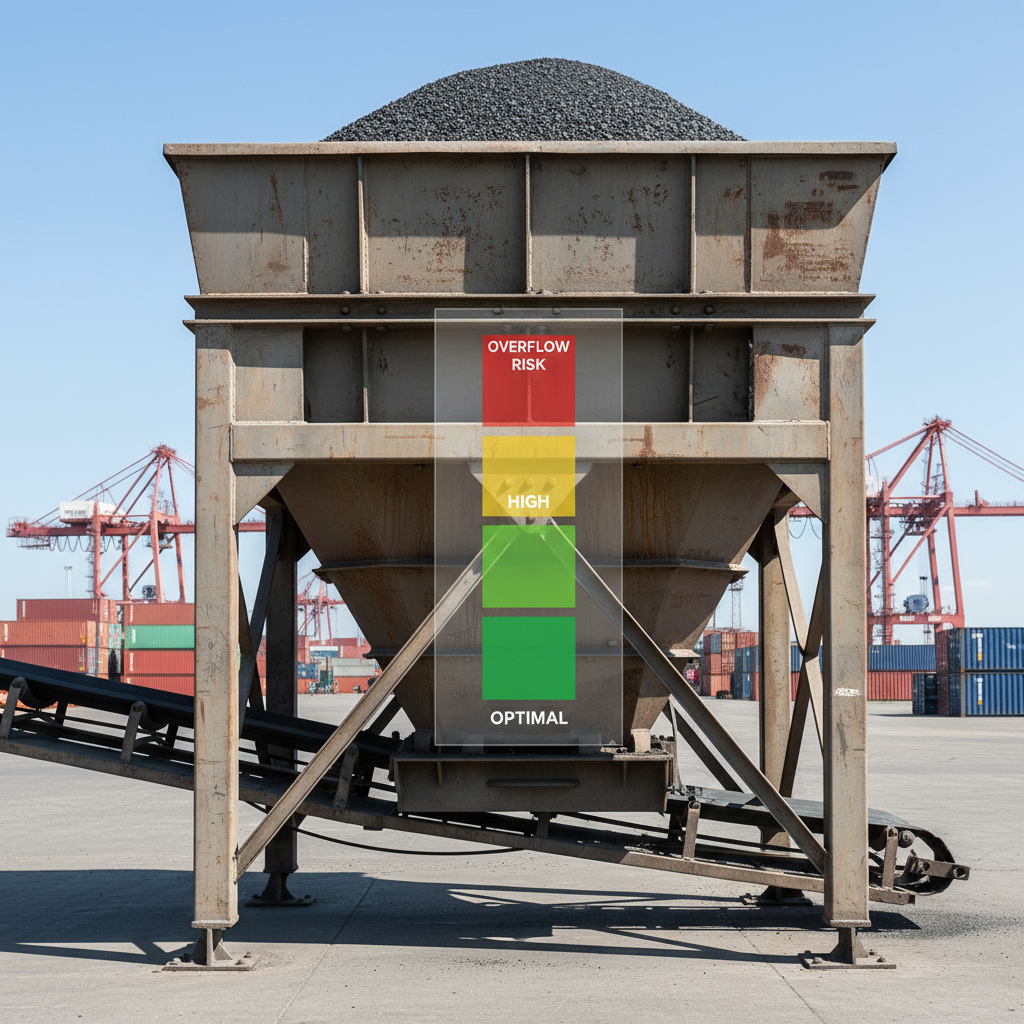
When the hopper is nearly full, the crane should slow down to prevent spillage. When nearly empty, it should accelerate. Currently this coordination happens via radio — subjective, delayed, and error-prone.
WHAT THE SYSTEM DOES
CV estimates pile height in the hopper zone and feeds this data to the operator pacing dashboard: "Hopper at 85% — reduce pace" or "Hopper clearing — resume full pace." Producer-buffer-consumer optimization.
Level sensors exist for hopper monitoring. CV-based pile height estimation with pacing feedback is novel.
KEY METRIC
Crane pace synchronized to hopper state. Zero spillage from overfill. Zero idle time from underfill.
Self-Improving AI — 24-Hour Model Enhancement Cycle
CURRENT STATE
Industrial CV models are trained once and deployed. When they encounter edge cases, they fail — and the failure persists until a human intervenes weeks or months later.
THE PROBLEM
Port environments are harsh and variable — salt spray, rain, dust, changing light, different vessel configurations. A model trained on clear-day operations will struggle at night or in fog.
WHAT THE SYSTEM DOES
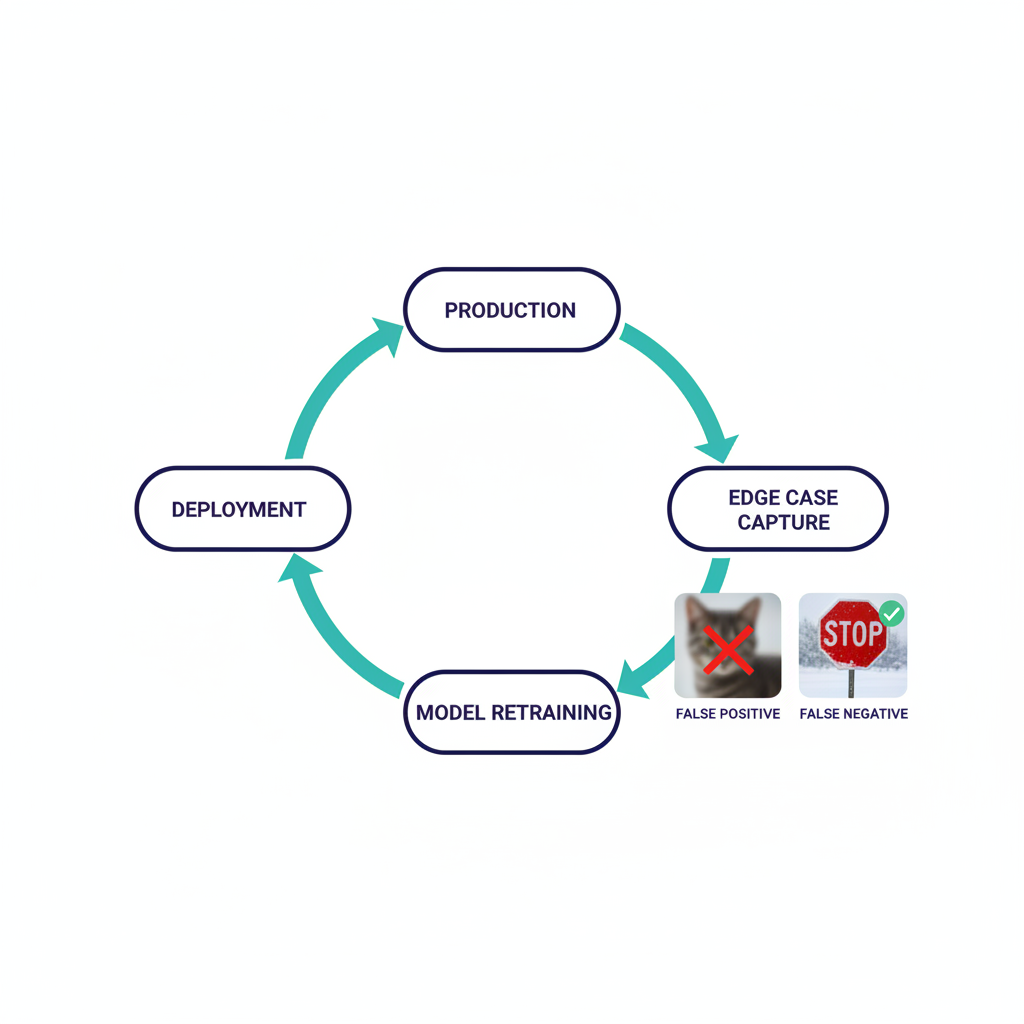
During production, the system automatically captures edge cases organized by failure mode: with_bucket (false negatives), no_bucket (false positives), uncertain (low confidence). A 24-hour cycle runs: Hours 0–8 production + capture, 8–12 data preparation, 12–20 model retraining, 20–24 deployment if improved.
Domain-specific capture taxonomy with failure-mode-to-training-polarity mapping — no commercial equivalent exists. No active learning pipeline exists in the port/maritime domain.
KEY METRIC
The system gets better every day. Not every quarter. Not every version release. Every day.
GLOBAL BENCHMARKING
The World’s Best Bulk Terminals — and What They Actually Use
If CV-based cargo settlement is such an obvious solution, why hasn’t Hansaport Hamburg or Port Hedland or Richards Bay already done it? Because the most advanced bulk terminals in the world have invested their automation budgets in material handling efficiency, not in cargo measurement innovation.
| Terminal | Location | Annual Throughput | Claim to Fame | Settlement Technology |
|---|---|---|---|---|
| Hansaport | Hamburg, Germany | 15M tonnes | World’s only fully automated bulk process chain | Belt scales for rail/barge loading |
| EMO Rotterdam | Netherlands | 60M tonnes | Western Europe’s largest dry bulk terminal | Conventional belt scales |
| Richards Bay Coal Terminal | South Africa | 91M tonnes | World’s largest coal export terminal | Centralized control + belt scales |
| Port Hedland | Australia | 500M+ tonnes | World’s largest bulk export port | Belt scales + Scantech GEOSCAN |
| NCIG Newcastle | Australia | 66–79M tonnes | Rockwell Automation predictive maintenance | Belt scales + SCADA |
| Haldia Bulk Terminal | India | New (2026) | India’s first fully automated dry bulk facility | Mechanized handling, conventional |
| South Louisiana | USA | Largest U.S. tonnage port | Mississippi River grain corridor | FGIS-certified shore scales + draft surveys |
| Port Tampa Bay | USA | Active deployment | World’s first CV-based cargo settlement | Multi-camera CV + draft calibration |
DEPLOYMENT
Port Tampa Bay: The World’s First Deployment
A major terminal operator at Port Tampa Bay, managing bulk cargo discharge operations for vessels carrying aggregate, grain, and construction materials, became the first port facility in the world to deploy computer-vision-based cargo settlement in production.
The operation: approximately two vessels per month at a dedicated berth, cargo offloaded by ship-to-shore grab cranes to hoppers, then conveyed to trucks for warehouse delivery. The core problem that drove adoption: ±5-tonne-per-truck variance creating ongoing cargo settlement disputes.
[Photo: General Manager, Terminal Operator at Port Tampa Bay]
What Was Deployed
Three cameras monitoring three critical points: two covering crane operations (swing cycle detection, VLM-based crane attribution), one covering the conveyor (volumetric flow measurement). Ship draft reports received every ~12 hours provide calibration ground truth. The system runs 24/7 during vessel discharge, producing real-time dashboards and formal settlement reports at operation completion.
“[PLACEHOLDER: General Manager\u2019s quote about specific results and what changed in their daily operations after deployment]”
— [Name, Title, Terminal Operator at Port Tampa Bay]
“[PLACEHOLDER: General Manager\u2019s quote about recommending the system to other terminal operators]”
— [Name, Title, Terminal Operator at Port Tampa Bay]
The Broader Significance
This deployment is not a pilot. It is not a proof of concept. It is a production system processing real cargo, generating real settlement documents, for a real commercial operation. The terminal operator has used the system across multiple vessel discharges, and the settlement reports are part of the commercial documentation chain.
MARKET OPPORTUNITY
The $3–6 Billion Opportunity
The financial opportunity spans the entire cargo settlement value chain, not just measurement accuracy, but the downstream costs that measurement uncertainty creates.
| Cost Category | Annual Global Estimate | How CV Settlement Reduces It |
|---|---|---|
| Cargo value at risk from discrepancies | $2.9–5.8 billion | Continuous per-crane accountability eliminates ambiguity at the source |
| Draft survey services | $1.2–1.8 billion | CV provides continuous measurement; draft surveys become calibration input |
| P&I cargo shortage payouts | $400–640 million | Evidence-based settlement documents reduce disputes |
| Measurement-related demurrage | $160–320 million | Real-time tracking eliminates delays from re-surveys |
| Legal and arbitration costs | $200–400 million | Auditable, timestamped evidence replaces negotiation |
| Total value chain | $3–6 billion/year |
INDUSTRY BENCHMARK
Why This Is a Global Benchmark
The port industry has seen this pattern before. In 1993, ECT Rotterdam’s Delta Terminal became the world’s first fully automated container terminal. ECT was the only automated terminal in the world for six years , until PSA Singapore followed in 1999. Today, approximately 53 automated container terminals operate globally, and every one follows the template ECT Delta established.
The pattern is consistent: a single deployment at a single location, when it represents a genuine category first, becomes the global benchmark that defines the standard for decades.
“A single deployment at a single location, when it represents a genuine category first, becomes the global benchmark that defines the standard for decades.”
Port Automation Firsts
1993
ECT Rotterdam
First automated container terminal
1999
PSA Singapore
Second automated terminal
2005
Patrick Brisbane
First automated straddle carrier
2026
Sensfix × Port Tampa Bay
First CV-based cargo settlement
Ready to Explore CV-Based Cargo Settlement?
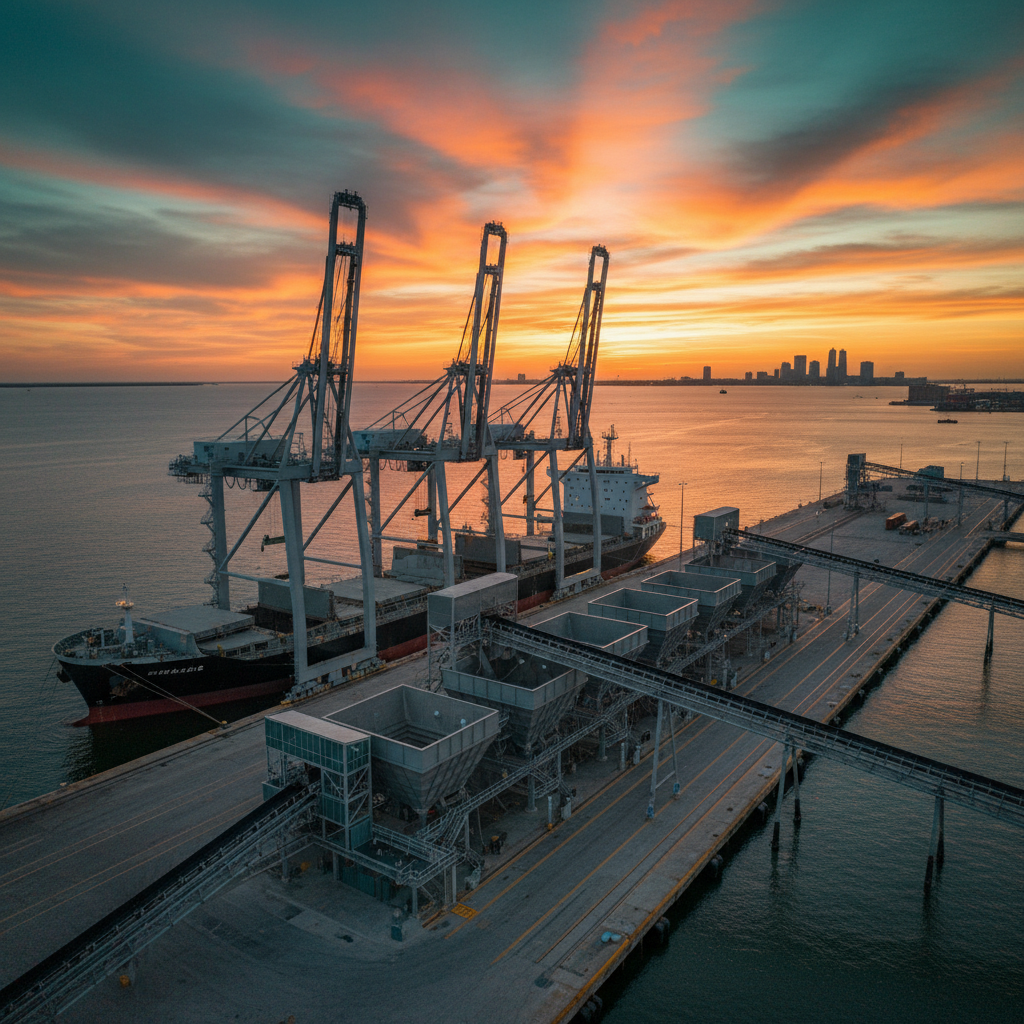
Download the full whitepaper, discuss a pilot deployment at your terminal, or explore all port AI capabilities.
© 2026 Sensfix Inc. All Rights Reserved.